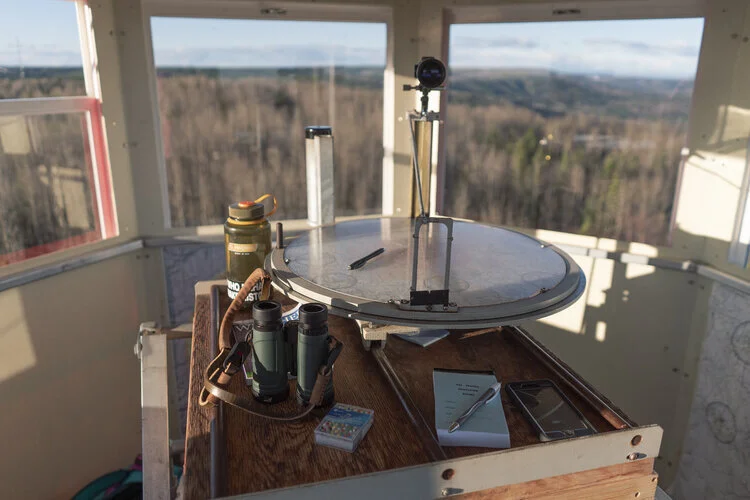
When I wrote my last post, a cheeky diary of an extreme hazard day, I was on a six-day streak of high and extreme hazard. Feeling fatigued and anticipating that rain was soon to come, I thought it would be fun to document what extreme was like at the fire lookout.
Read MoreTwo weeks at the tower. 75 climbs up and down the ladder. 18 millimeters of rain. 100 seeds planted. Twice daily weather reports over the radio. Countless hours of watching clouds and squinting at distant smudges, trying to distinguish smoke from road dust, gas flares, snow patches, or cutblock, when the sun hits them at just the right angle to deceive weary eyes into seeing rising smoke.
Read MoreI started grad school almost exactly half a year ago. Six months. Apparently that's how long it takes me to get to a point of clarity where the tasks I'm doing have stopped seeming so daunting and abstract, and all of the different components of my coursework, my reading, and my project development actually seem to align to represent something productive and tangible.
Read MoreFor this study, four different methods are evaluated for interpolation Snow Water Equivalent data: Triangulated Irregular Network, Inverse Distance Weighting, Kriging, and Trend Surface Analysis. It is critical to identify the most appropriate spatial interpolation method as there is no ideal method, and suitability is based on study objectives, and the characteristics of the dataset used.
Read MoreThe use of census data in this study will be to observe population density in the Capital and Cowichan Valley Regional Districts of southern Vancouver Island and familiarize with the concept of spatial autocorrelation through using global and local statistics to evaluate spatial patterns in population density distribution.
Read More


